Why $4.99 beats a spreadsheet and a bookkeeping subscription
Most founders and freelancers track cash in one of two ways: a spreadsheet they built themselves, or a bookkeeping subscription that bills every month. FlowingPulse sits between them on purpose — the speed and control of a spreadsheet, with the maintenance and alerting of a real product, for one payment of $4.99.
The spreadsheet is free until it isn't
A self-built cash sheet starts as ten minutes of work. Then you add a tax column, then a recurring-expenses tab, then a runway formula that references three other sheets. Within a quarter you are maintaining a small piece of software with no tests, no history and exactly one person who understands it.
The costly part is never the file — it's the hour a month you spend pasting bank exports, fixing a broken reference, and re-deriving numbers you already calculated last month. At even a modest hourly value, one afternoon of spreadsheet repair costs more than this product does once.
FlowingPulse keeps the parts of a spreadsheet that matter — direct number entry, CSV in, CSV out, nothing locked away — and removes the part that doesn't: rebuilding the same formulas every quarter.
Bookkeeping SaaS solves a different problem
Accounting platforms are built for filing, reconciliation and handing a clean ledger to an accountant. That's real work, and if you need it, pay for it. But their monthly price is set by that scope: double-entry ledgers, invoicing, payroll, multi-user permissions and compliance reporting.
If your actual question is "how many months of cash do I have left, and what happens if this client doesn't renew", you are paying a yearly subscription for a dashboard widget. The runway view is usually the smallest screen in the product, and it rarely models a tax buffer the way a solo operator needs.
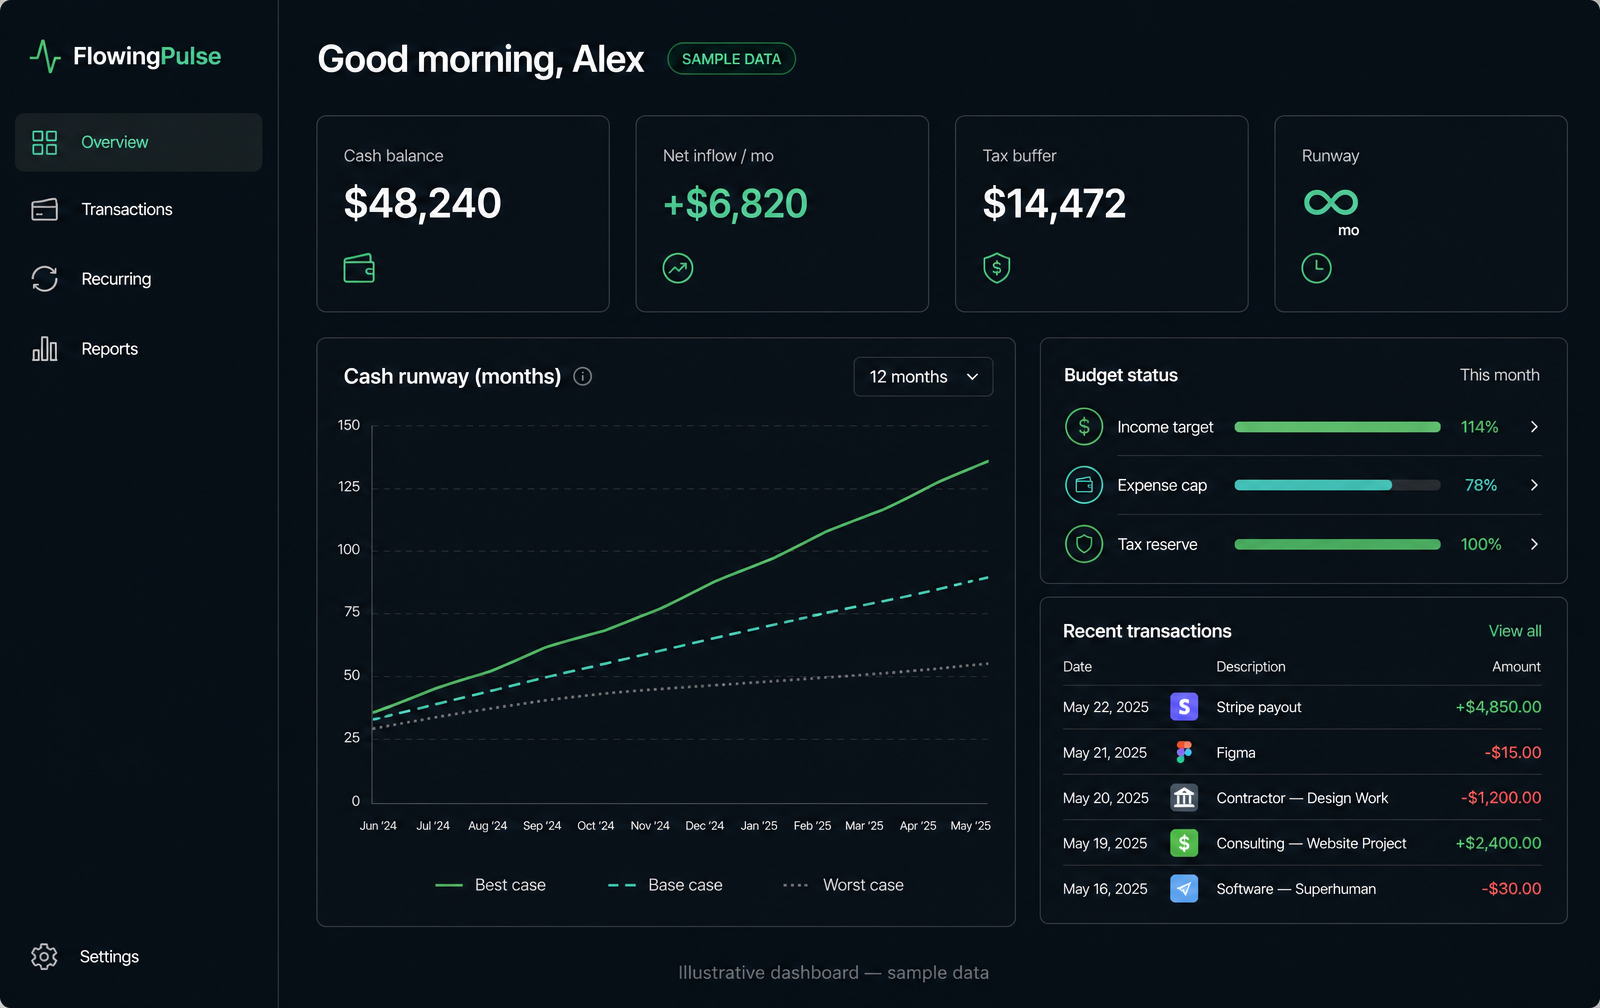
FlowingPulse answers that one question properly: net burn, runway months, tax set-aside, recurring spend, and a forecast that shows the month the balance turns negative.
What the $4.99 actually buys
One payment unlocks the dashboard permanently: interactive spending charts (twelve months of income, expense and net, plus a category breakdown pie), a live budget overview showing total budget, spent, remaining and this month's inflow against outflow, weekly and monthly report emails to you and up to five other recipients, CSV import with automatic categorisation, runway forecasting, tax buffer modelling, budget threshold alerts, CSV export, and an undoable audit log on every change.
There is no seat count, no usage tier and no renewal date. Your data stays exportable, so leaving costs you nothing but a download — which is the point. A tool that keeps your cash honest shouldn't need to hold your data hostage to keep billing you.
Compared against a spreadsheet you maintain yourself, the trade is one afternoon of your time. Compared against a bookkeeping subscription, it's roughly the first week of one month's bill — and then it never charges again.
Three things you'll actually open every week
The budget overview is the first screen after signing in: total budget, spent so far, what's left, and this month's income against expenses — with a progress bar that turns amber at 70% and red the moment you overshoot. The number that matters is on screen before you click anything.
The charts give those numbers a shape: twelve months of income, expense and net in one view, plus a category pie showing where the money actually went. And on your chosen day, the weekly report arrives on its own — burn, runway and biggest movers in plain language, to your inbox and up to five people you pick. That combination is what $4.99 buys, once.
Start with the free calculators if you want proof first. When the numbers matter enough to track every month, $4.99 moves them into a dashboard that keeps working without you.